Options for changing the Display: View - Tab
Time to read: ~7 min
The View tab page is where general options in terms of displaying the data can be manipulated. Most items also have a short-cut key option
to allow a more fluent interaction with the application and the display of data. The available options are shown below:
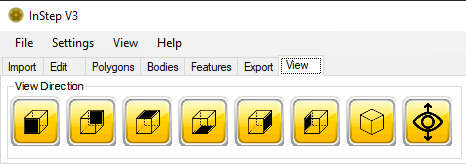
 Views Tab Page
The behavior of each of these items is discussed in more detail below:
 Isometric View
The Isometric View aligns the view so that each side of a cube obtains the same projection onto its corresponding axis.
 Closest View
The 'Closest' view orientation is a shortcut to align the view with whichever standard view (excluding the isometric view) is the closest to the currently oriented view. This
allows the user to roughly orient the graphical content in a desired orientation and to then use the button (or F8 for default shortcut key) to snap the
view to the principal orientation.

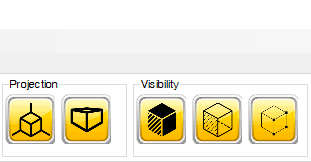
 View Projections
The Perspective and
Orthographic projection options can be selected to better
represent the graphical components in a way that the user prefers to interact with them. Orthographic projection mode allows relationships
between different component's sizes to be better illustrated as their size is not affected by how close to the viewer they are located.
On the other hand, the perspective projection mode (default), is closer to what most users are used to seeing in both CAD applications and
real life.
It should be noted that the zoom mode works slightly differently between the two modes as they do not have a matching way in which the proximity
of the user to the data is accounted for as one works on moving the location of the viewer along the forward axis and the other on modifying the
overall scale. Some experimentation to learn about the particulars in working with either mode is encouraged.
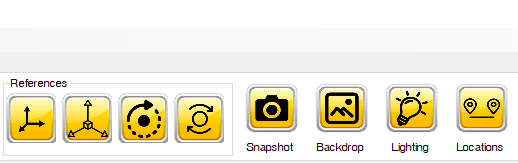
 Snapshot
This option creates a static image from the currently displayed view. It is possible to use this (together with perhaps a white background) to
create something like a very basic 'blue-print' of a file by taking a snap-shot and then editing the resultant image in a standard image editor
or Office application. Whatever the purpose, this option is essentially the same as using a Print-Screen approach.
 Backdrop
The Backdrop option allows a custom set of colors to be applied to the background of the data being shown. Colors can be set to the top and bottom
(with a linear gradient applied between them) or the colors can be flipped.
 Lighting
The Lighting option toggles between a standard illumination mode and one that includes an elevated level of ambient light. The main purpose
for including this option is that in some cases, especially when shapes are viewed from the 'inside', surfaces can appear overly dark and faces and
edges become difficult to distinguish. This option allows the interior surfaces, which are a dark grey by default, to be displayed in a lighter mode
and therefore make the edges more visible. Generally, this should not be necessary, but it may be helpful in cases where the color choices do not allow
clear distinction of features.
 Locations
If detailed investigation of shapes, locations and similar are being done, it can be helpful to insert custom geometry without affecting the
source data being worked with. The Locations option allows for points, lines and triangles to be inserted without being made part of the data
that is being imported/exported. Clicking this button brings up a dialog box where the data can be directly entered (likely through a copy-paste
operation).
The button is a toggle-type button and on first clicking it, it will ask for user input. On clicking it again, it will remove previously added items.
The format of the data being added is highly flexible:
- Single Points
- are added by using a format x1,y1,z1 @ x2,y2,z2 @ xn,yn,zn where the delimiter '@' can be any combination of brackets ( '{','[','(' and '}',']',')' ),
line feed characters or similar, standard delimiters such as ';', ':', '/', '|', '\'.
The comma sign ',' and (white-) space characters are used exclusively for defining delimitation between coordinates. Use of both Space and Comma allows
users in countries where the comma serves as the decimal delimiter to avoid such issues. In countries where a period ('.') is used as the decimal delimiter,
either characters can be used but in either case, the decimal value must follow any localization used by the operating system.
- Lines
- Including lines is accomplished with exactly the same formatting as the points but rather than supplying a triplet of coordinates (x1,y1,z1) for each point,
the lines require two coordinate triplets (so {ax,ay,az,bx,by,bz} for a single line going from a point 'a' to a point 'b'). Multiple lines are created
in the same way as for the points defined above.
- Triangles
-
Not surprisingly, triangles follow the same approach as lines but use three coordinate tripplets. Thus { ax,ay,az,bx,by,bz,cx,cy,cz } would define
a triangle using the points a,b and c. Multiple triangles can be added in this way too, using the previously mentioned groupings.
This approach should aid in inspecting data by means of inserting specific points, pointers or similar. It is best considered for cases
where a specific location may be causing issues (i.e. provided by a different tool that identifies problem locations) as a way to troubleshot
those items and perhaps manually re-building or deleting the data.